Maxent model for Acorn Woodpecker (ACWO)


This page contains some analysis of the Maxent model for ACWO, created Tue Apr 10 15:07:00 PDT 2007 using Maxent version 2.3.


Analysis of omission/commission

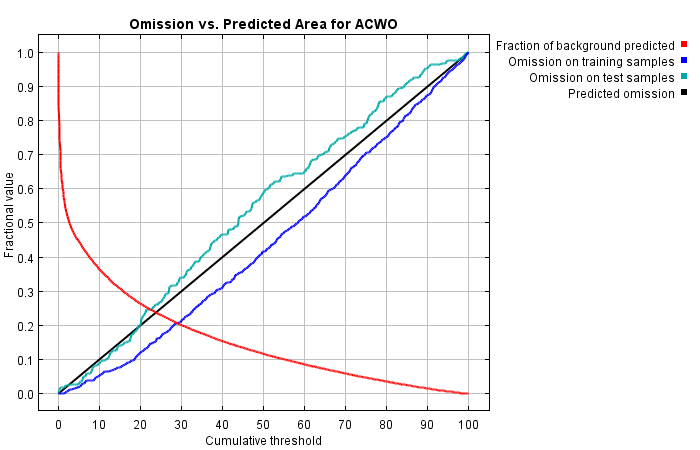
The following picture shows the omission rate and predicted area as a function of the cumulative threshold. The omission rate is is calculated both on the training presence records, and (if test data are used) on the test records. The omission rate should be close to the predicted omission, because of the definition of the cumulative threshold.


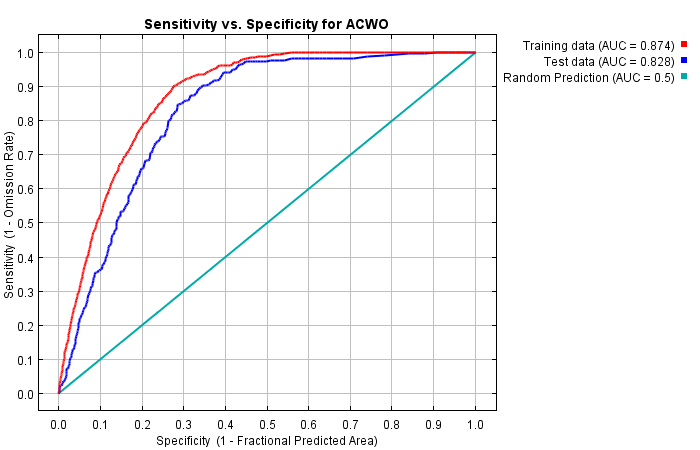
The next picture is the receiver operating characteristic (ROC) curve for the same data. Note that the specificity is defined using predicted area, rather than true commission (see the paper by Phillips, Anderson and Schapire cited on the help page for discussion of what this means).


Some common thresholds and corresponding omission rates are as follows. If test data are available, binomial probabilities are calculated exactly if the number of test samples is at most 25, otherwise using a normal approximation to the binomial. The "Balance" threshold minimizes 6 * training omission rate + .04 * cumulative threshold + 1.6 * fractional predicted area.

Cumulative thresholdDescriptionFractional predicted areaTraining omission rateTest omission rateP-value
1.000Fixed cumulative value0.6020.0000.0194.352E-30
5.000Fixed cumulative value0.4440.0200.0336.971E-54
10.000Fixed cumulative value0.3650.0540.0893.41E-62
1.189Minimum training presence0.5840.0000.0192.15E-32
18.53110 percentile training presence0.2760.1000.1820E0
29.023Equal training sensitivity and specificity0.2070.2070.3276.743E-64
18.531Minimum training sensitivity plus specificity0.2760.1000.1820E0
22.343Equal test sensitivity and specificity0.2480.1450.2480E0
17.313Minimize test sensitivity plus specificity0.2860.0920.1540E0
1.708Balance training omission, predicted area and threshold value0.5460.0020.0234.693E-37


Pictures of the model

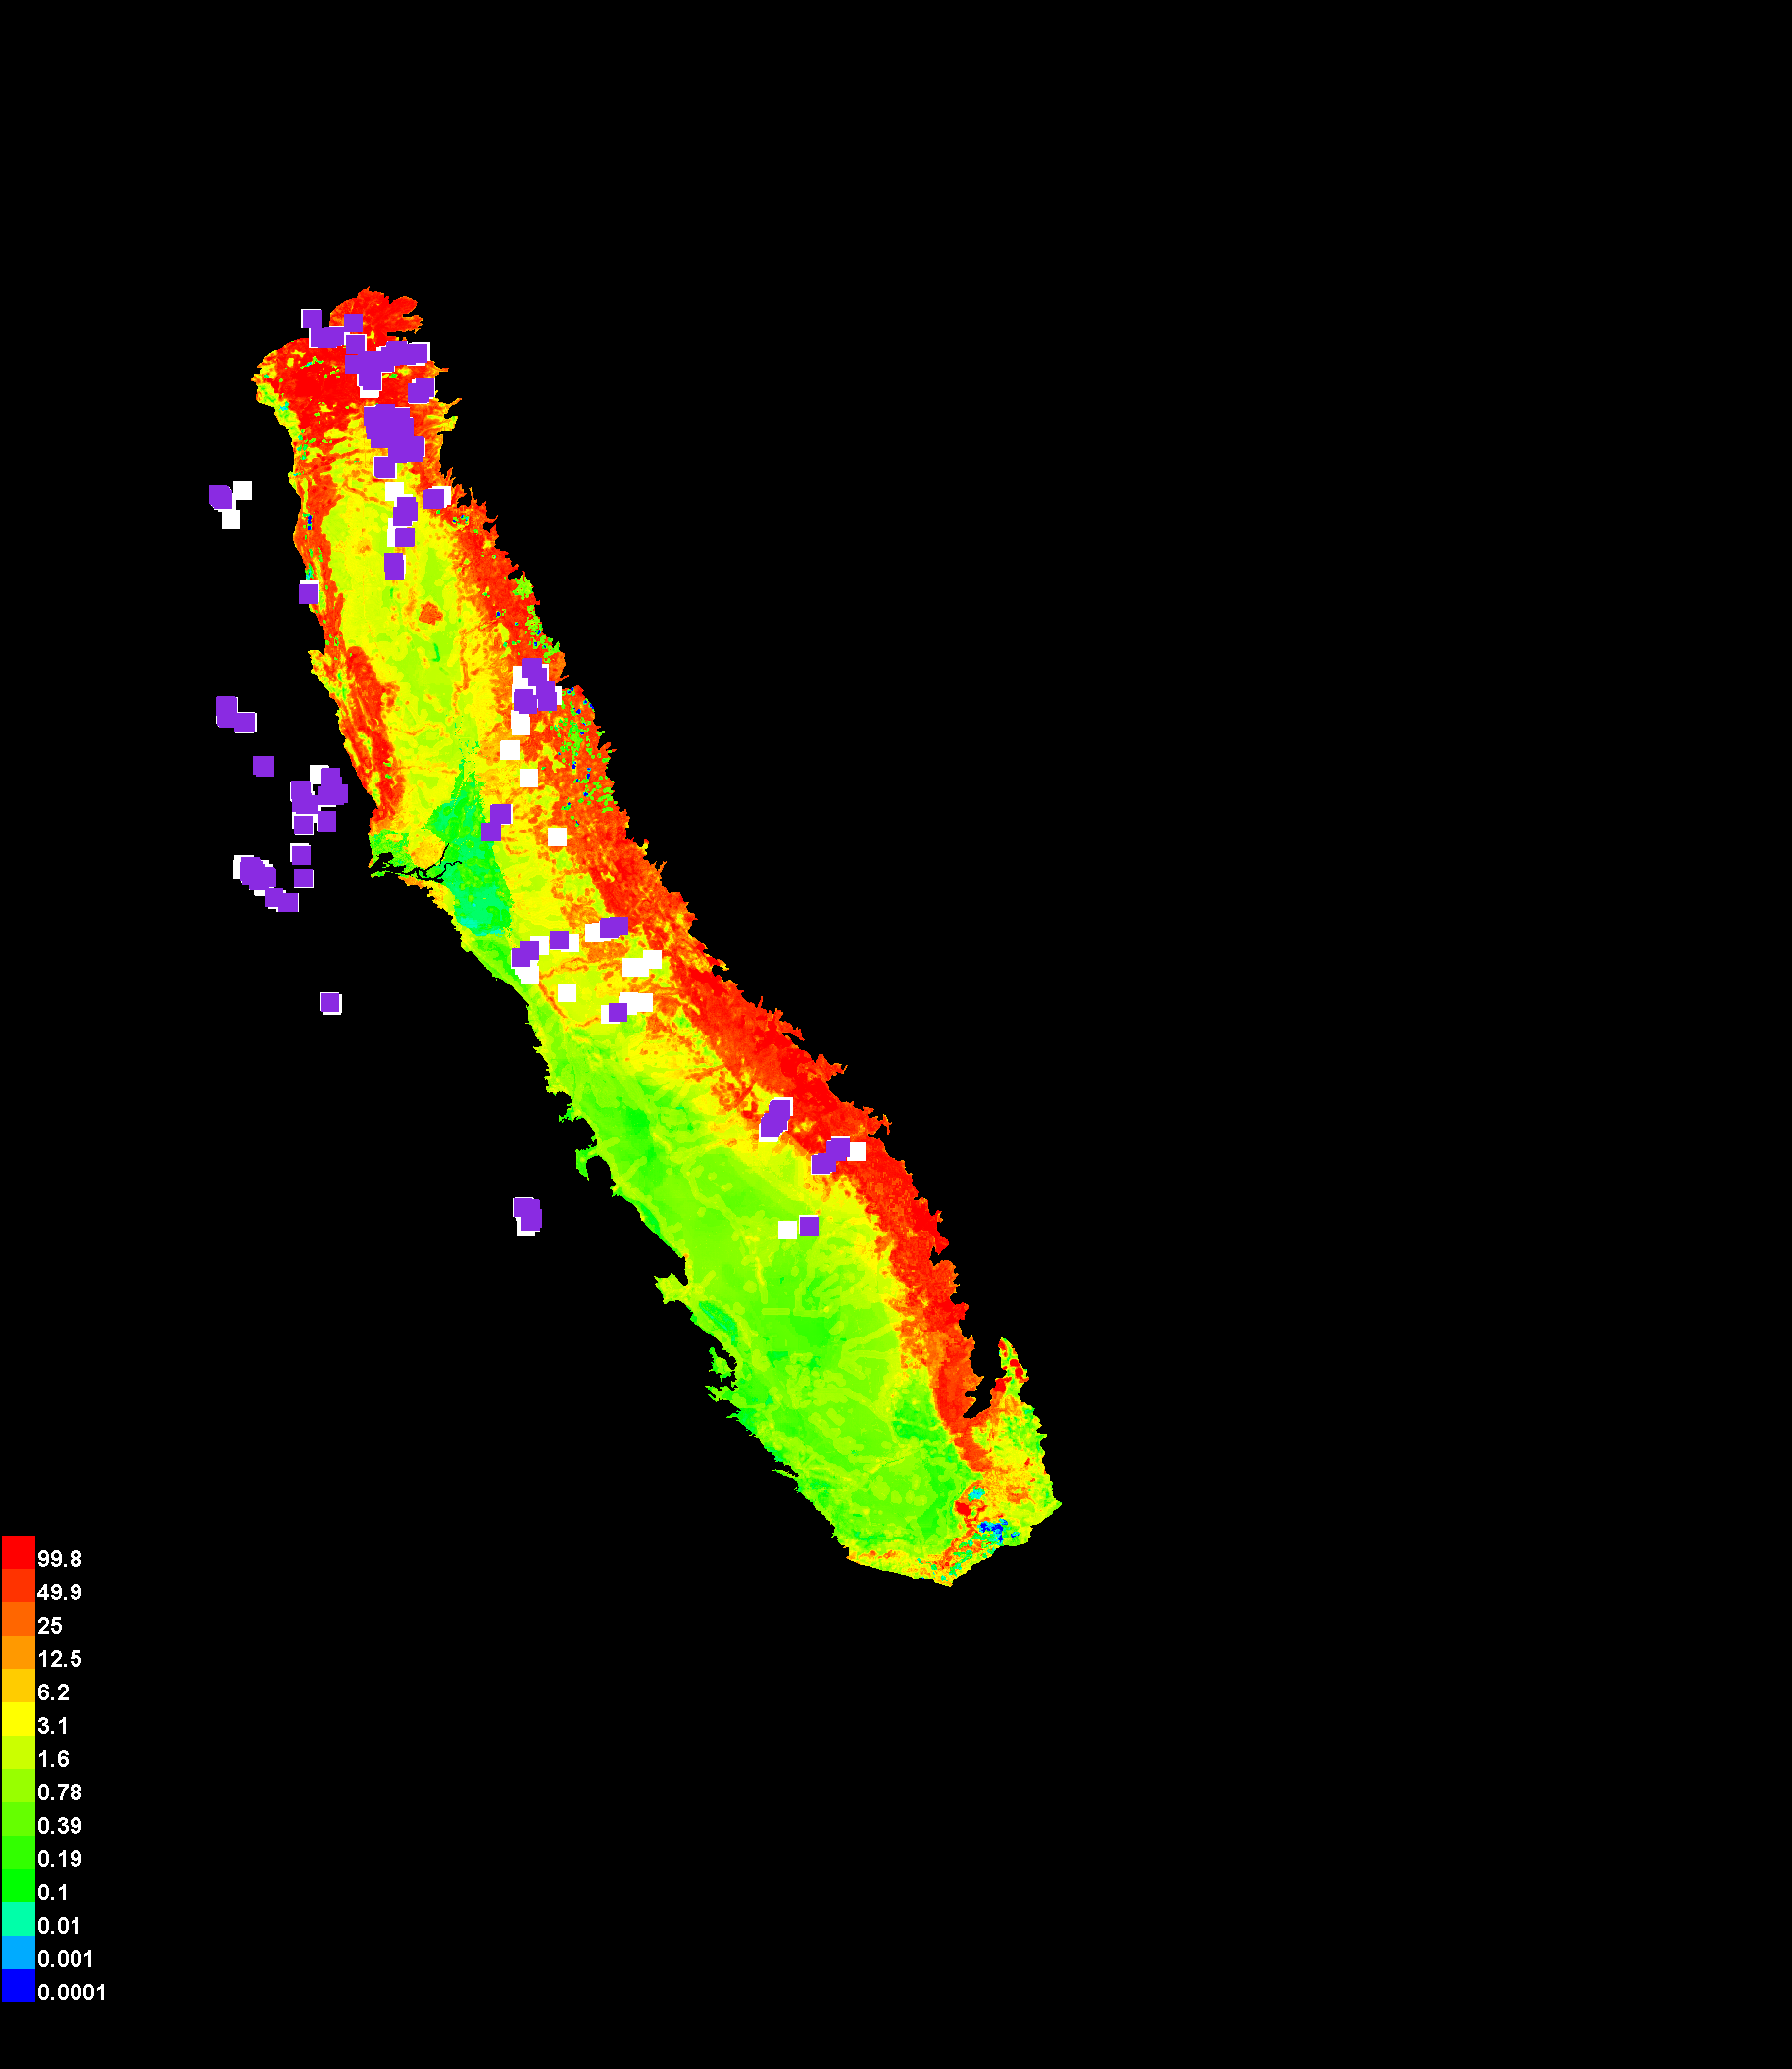
This is the projection of the Maxent model for ACWO onto the environmental variables. Warmer colors show areas with better predicted conditions. White dots show the presence locations used for training, while violet dots show test locations. Click on the image for a larger version.


Response curves


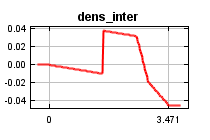
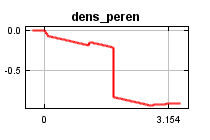
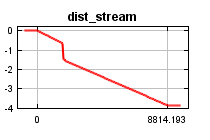
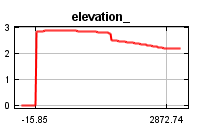
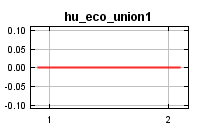
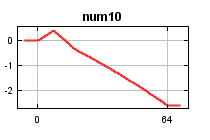
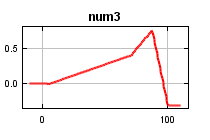
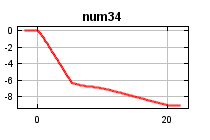
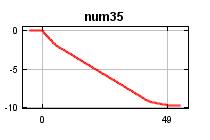
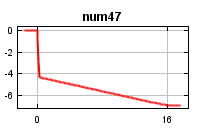
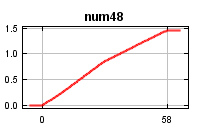
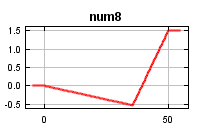
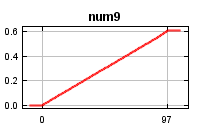
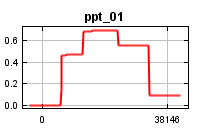
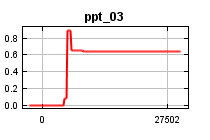
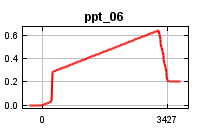
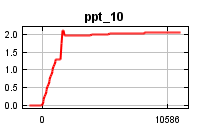
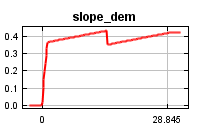
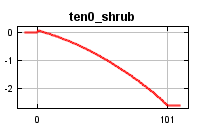
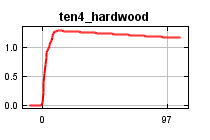
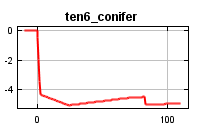
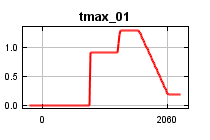
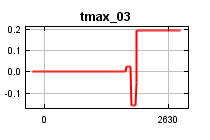
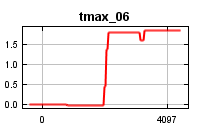
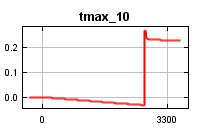
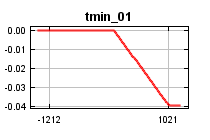
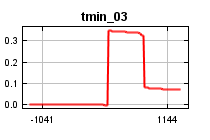
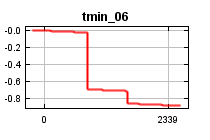
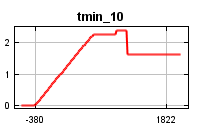
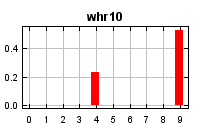
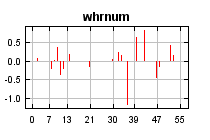
These curves show how each environmental variable affects the Maxent prediction. The (raw) Maxent model has the form exp(...)/constant, and the curves show how the exponent changes as each environmental variable is varied, keeping all other environmental variables at their average sample value. Click on a response curve to see a larger version.


Analysis of variable importance

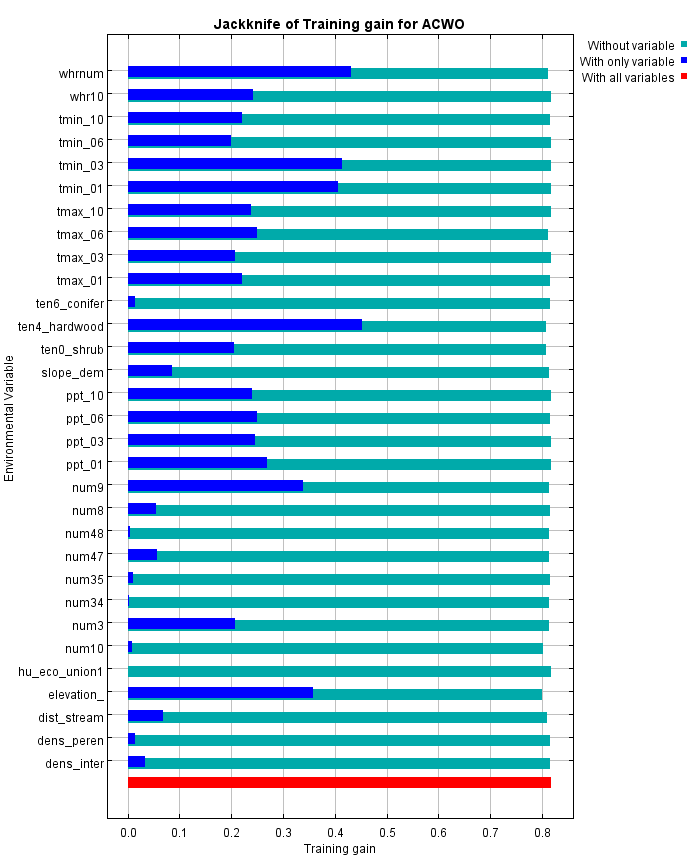
The following picture shows the results of the jackknife test of variable importance. The environmental variable with highest gain when used in isolation is ten4_hardwood, which therefore appears to have the most useful information by itself. The environmental variable that decreases the gain the most when it is omitted is elevation_, which therefore appears to have the most information that isn't present in the other variables.


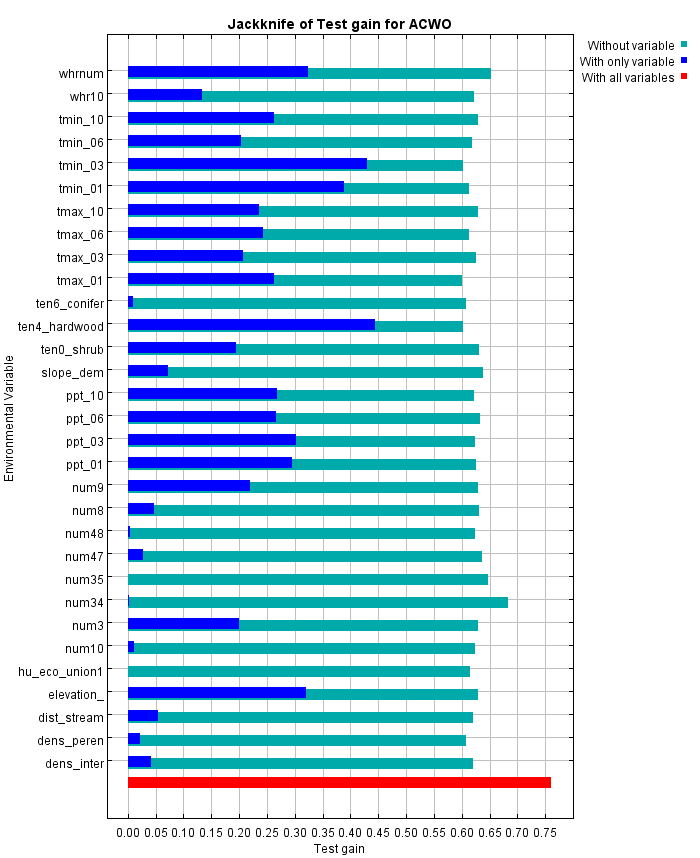
The next picture shows the same jackknife test, using test gain instead of training gain. Note that conclusions about which variables are most important can change, now that we're looking at test data.


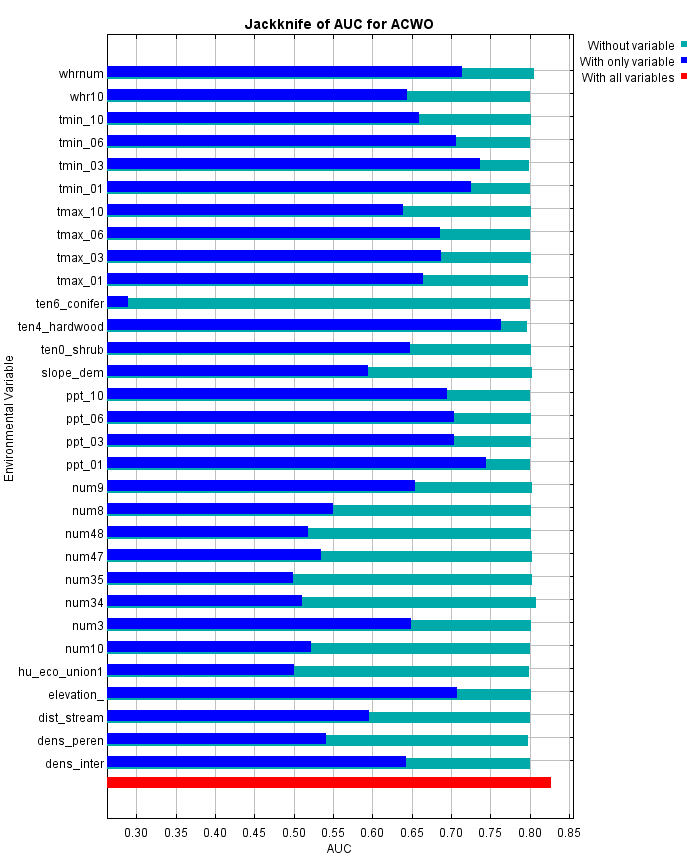
Lastly, we have the same jackknife test, using AUC on test data.


Raw data outputs and control parameters


The data used in the above analysis is contained in the next links. Please see the Help button for more information on these.
The model applied to the training environmental layers
The coefficients of the model
The omission and predicted area for varying cumulative and raw thresholds
The prediction strength at the training and (optionally) test presence sites
Results for all species modeled in the same Maxent run, with summary statistics and (optionally) jackknife results


Regularized training gain is 0.818, unregularized training gain is 0.913.
Unregularized test gain is 0.761.
Test AUC is 0.828, standard deviation is 0.010 (calculated as in DeLong, DeLong & Clarke-Pearson 1988, equation 2).
Algorithm terminated after 500 iterations (129 seconds).

The follow parameters and settings were used during the run:
643 presence records used for training, 214 for testing.
10643 background points used during training.
Environmental layers used: dens_inter dens_peren dist_stream elevation_ hu_eco_union1 num10 num3 num34 num35 num47 num48 num8 num9 ppt_01 ppt_03 ppt_06 ppt_10 slope_dem ten0_shrub ten4_hardwood ten6_conifer tmax_01 tmax_03 tmax_06 tmax_10 tmin_01 tmin_03 tmin_06 tmin_10 whr10(categorical) whrnum(categorical)
Command line:
Feature types used: Linear Quadratic Product Threshold Hinge
Regularization multiplier is 1.0
Regularization values: linear/quadratic/product: 0.050 categorical: 0.050 threshold: 1.000 hinge: 0.500
Output format is Cumulative
Output file type is .asc
Maximum iterations is 500
Convergence threshold is 1.0E-5
Random test percentage is 25
Jackknife selected
Make pictures selected
Create response curves selected
Minimize memory selected